Pages

Showing posts with label Macroeconomic Monday®. Show all posts

Sunday, June 23, 2019

How Can The Market Be at An All Time High and There Be A Freight Recession - Part II

In my previous post I outlined why I believe freight is slowing.  Certain signals in the marketplace are telling us employment adds are decreasing, inventories are increasing and the PMI is decreasing.  All of these are signs of a slowing economy.  (For the record, I do not believe by any stretch the economy will contract - it is just we should not get used to GDP growth rates of 3% into the future).  This slowing has resulted in less loads per truck and prices going down.

So, how can the stock market be hitting an all time high?  I believe it is due to 3 reasons (Warning, I know a lot more about freight than I do about investing but here goes):

  1. The alternative investment (10yr as a proxy)
  2. % of the economy which has nothing to do with goods
  3. The Fed.
What is happening:

Let me start off by showing what is actually happening:


This chart compares the Dow Jones Transportation Index to the DJ30 and the S&P500.  This is a one year return graph and ends on June 21.  As of June 21, the DJ30 is up 6.66%, the SPX is up 7.1% and yet the DJT is DOWN 3.91% Bottom line is investors are shunning transports yet still embracing the overall economy.  Why?

The Alternative Investment:

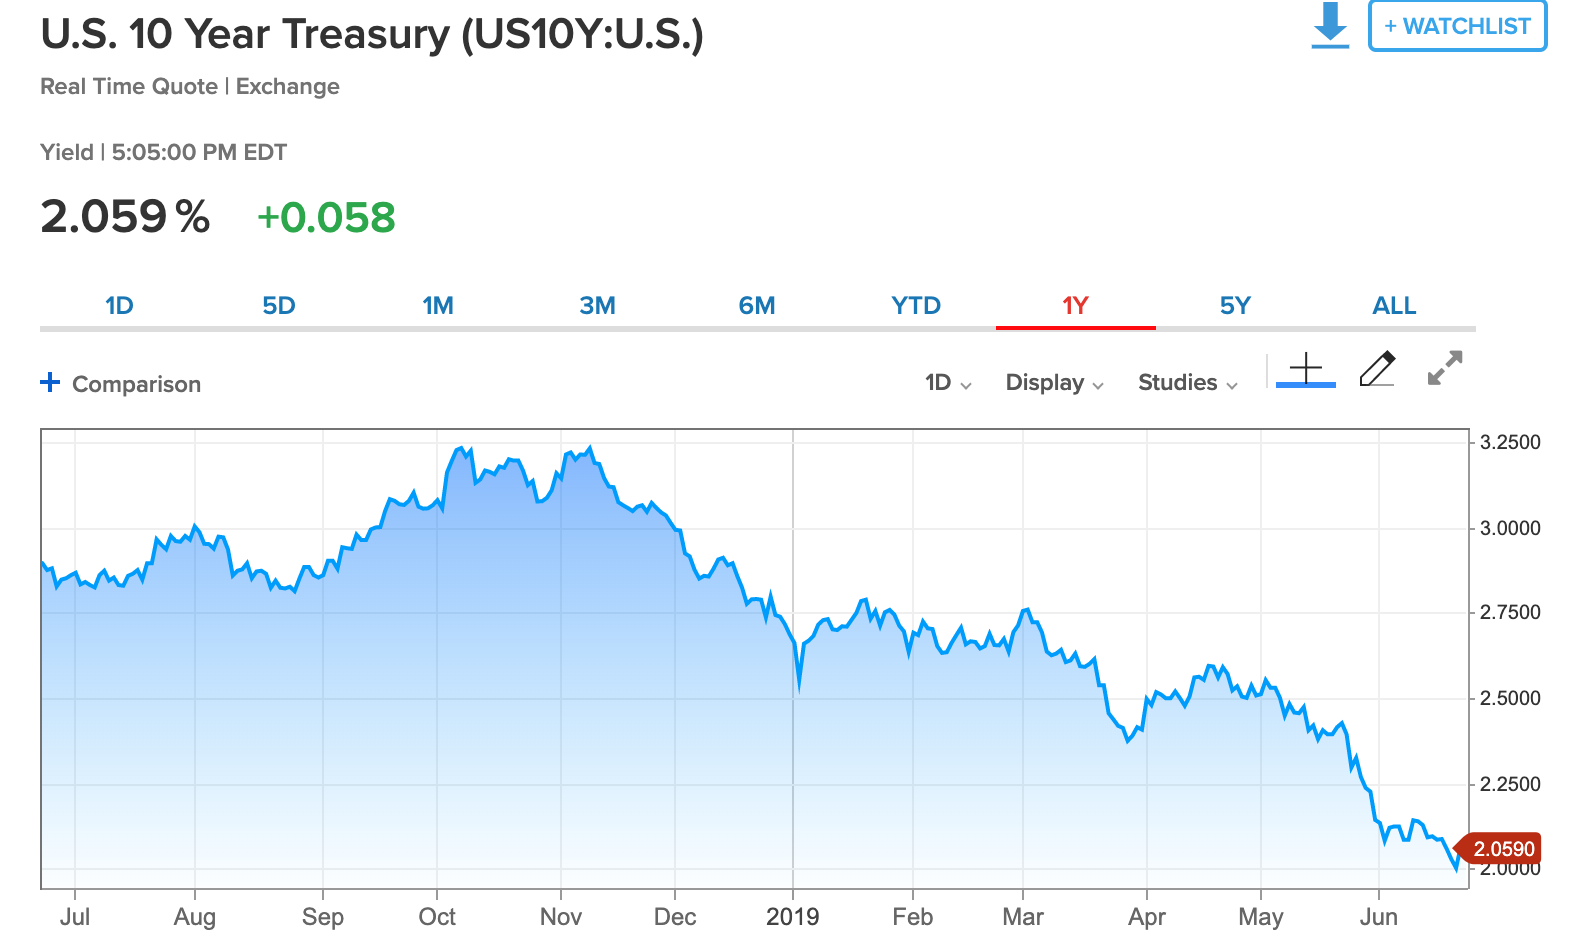
Investors are going to invest.  That is what they do and they have two macro alternatives.  First, they can invest in the "risk" markets (i.e., stocks) or they can invest in what is generally considered the "risk free" or "near risk free" investment.  I will use the 10yr as a proxy for this second grouping.  What we have seen recently is not only a 10 year treasury at multi year lows but we are also hearing the Fed discussing lowering the rates even further.  This will drive investment dollars away from the "risk free" and into the markets. 

It is no coincidence towards the end of last year when the Fed was not only raising rates but also calling for 3 rate hikes in 2019 the stock market tanked.  Investors were deciding to move away from risk assets as the risk free was looking pretty good.  Not so much any more as the 10yr is now bouncing around the 2% level.

The graph to the left is the graph of the 10 year treasury rates as of Friday, June 21.  This movement of rates down has caused money to flow back into the risk asset markets and specifically look at the major move down since mid May.  This is when the Fed made it pretty clear the only action they likely will take is a move down in rates. 


% of The Economy Which Does Not Have Anything to Do with Shippable Goods:

This one is a bit nuanced.  Let's just look at 30 years ago and think about what it meant for the economy to be growing at 3%.  It was intuitive that the growth had to have much to do with autos, real hard electronics, housing etc. etc.  These are all very "hard" goods which drove the economy. 

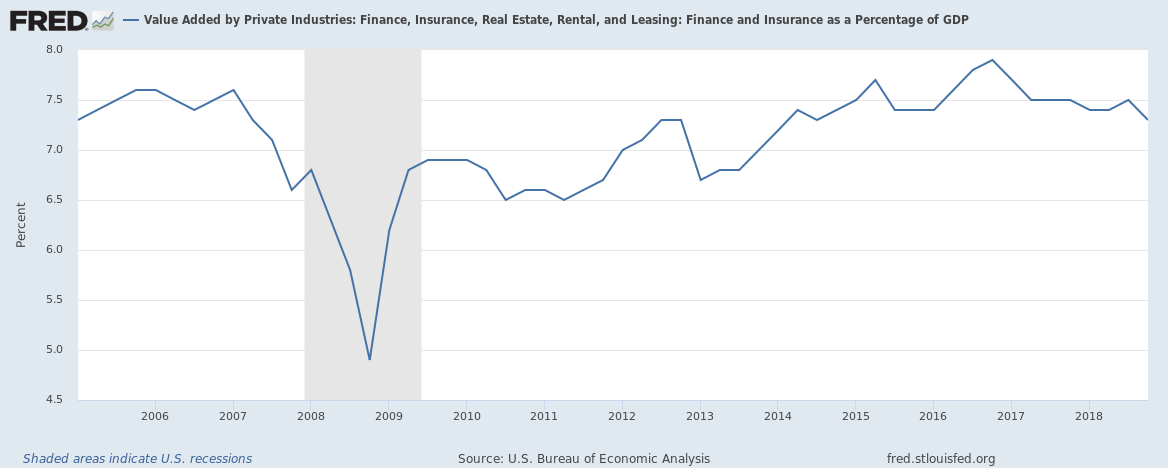
Today, when we the economy grows at 3% more of it has to do with finance, services and the infamous FANG stocks (Facebook, Amazon, Netflix and Google - Alphabet).  Only one of these, Amazon, ships anything.  The rest make their money in the "virtual" world.  Very important to the economy but not so important to trucking.  The graph below illustrates this:

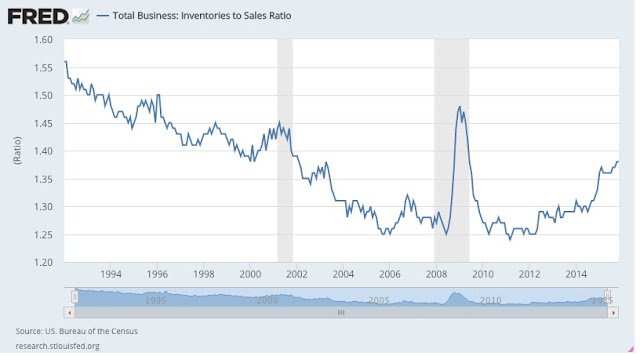
Non Shipment Economy
The inverse of this graph is to ask how much of GDP is due to MFG:


Both of these graphs tell the same story.  GDP can grow at a high rate and not have shippable product tendered to carriers.  - Economy grows yet a freight recession sets in. 

The Fed

What else can I say?  The Fed has made a huge 180 degree turn around in the last few months and whether that is due to political pressure or real economics I will leave it to the real economists to figure out. But, reality is, the Fed has signaled rates are going down and they have somewhat backed themselves into a corner as it would be outright lying if they did not do this.  This means more money will continue to go into inflating the asset bubble and less money will go into bonds. 

I hope I have now explained (sorry for the two part length) why the freight recession likely will continue however the economy, as measured by the markets and GDP, will continue to do quite well.  

Summary:
  1. Economy is slowing
  2. Investors have to invest in the market to get any kind of return due to the "risk free" paying so low.
  3. Investors are shunning the transports
  4. This drives the market to records
  5. Less and less of the GDP has to do with "shippable goods"
This is a link to Part 1 of this posting (for those reading on a reader)


How Can The Market be at All time High and There Be a "Freight Recession"? - PART I

The question posed in the title can be a perplexing problem and I am sure is of interest to both those who make a living running trucking companies as well as those who invest in them.  If the market is a forward looking index (like they teach you on school) then the fact it has bid up stock prices would indicate it believes the economy is "booming" and if the economy is "booming" then there must be a lot of freight moving.  I will attempt to explain why this connection (Market to freight volumes) is no longer true. 

There will be two parts to this posting. The first will be to show the macroeconomic data I look at which tells me the freight market is slowing.  The second part will be to show how the stock market could hit an all time high while the freight market slows.

There are 3 real reasons why the market (i.e., the SP500 and the Dow) is disconnected from what we, the "transporters of freight" see in the market:

  1. The alternative investment (i.e., 10yr).
  2. The % of the economy which has nothing to do with "goods". 
  3. The Fed
Before I address each one, let's look at the data which supports why there is a "freight recession".  For this I look at 3 different indices.  First, my favorite, the "Total Business: Inventory to Sales Ratio" (St. Louis Fed).  This measures how much activity is being used just to build inventories and the assumption is companies will not build inventories forever.  When they stop building, the freight stops.  Here is what the graph looks like back to 2015:

Inventory to Sales Ratio - St. Louis Fed
This graph clearly indicates (looking at the boom and bust cycles) inventories decrease then, in a recession, they increase.  The shaded areas above are key recessions.  You can see leading up to 2016 the economy was slow and it actually was close to the peak of the 2001 recession in 2016.  Then came the "sugar high" of expectations and tax cuts and the inventory was burning down until close to the end of last year.  Since then, the economy has been building inventory.  Not a good sign for the economy overall but more importantly, for this blog, not important for the freight industry.  I feel like I should not have to say this however just to be clear, companies do not build inventory forever.  So, even if freight does not slow immediately there would be a clear expectation from the rational investor that freight will slow.  Freight has slowed. 

Second, let's look at the PMI trends.  As a reminder, the PMI (Purchasing Manager's Index) generally gives you a look at whether the economy is expanding or not.  A reading of 50 or above is generally good and below that is contraction.  The index I like to look at is the MFG PMI:

MFG PMI - Tradingeconomics.com
I do not think I need to explain what is happening here suffice to say the decrease started around December of 2018 and has accelerated since then.  

Since so much of the freight indices are tied up in hauling manufactured goods it is no doubt looking at this chart that there would be far less freight to haul and far fewer loads per truck then we would like.  

The final piece of economic information is our labor force and the net change for employment.  For this, I like to use a 3 month net change from the bureau of labor statistics.  Why 3 months?  Because BLS adjusts the previous two months as they get better data so by going to a 3 month net change you take into account most of the adjustments. 

While employment is incredibly robust and generally "all is good" there are some signs of cracks:

3 Month Net Change in Employment - BLS
While there is still net positive adds what this is showing is the net positive is slowing quite a bit.  Could be we have just run out of workers or it could be, based on the data above, employers are starting to be very cautious about adding any more employees. 

To give you an example of this, the last three months (Mar, Apr, May 2019) readings were 521, 433(p), 452(p) (p - preliminary readings) respectively.  All three of those were below the lowest reading measured in 2018 which was 565 (January 2018).  Another indication of a slowing economy.  

Ok, so, the bottom line for this PART I is clearly the economy is starting to slow.  Not in a recession (yet) but clearly slowing.  I have opinions on why and I will leave those to myself but this is why you are seeing the FED not only not increasing rates but the conversation is now about lowering rates. 

Stay tuned for PART II which will discuss the 3 reasons why the market, even though all these indicators show a slowing, hit new highs. 

Sunday, May 27, 2018

Macroeconomics are Supporting The Tight Freight Market (Macroeconomic Monday)


I wanted to write a quick note about the tight freight market.  We all know it is tight and certainly there are no lack of free webinars telling us how to be a "shipper of choice" and make our freight easier to handle.  With this note, I wanted to outline a few key statistics which will help you quantify the issue. 

Macroeconomics:

PPI
There are three items I want to show.  First, the PPI for General Freight, Trucking, Long Distance Truckload.  This important statistic produced and updated by the government tells us what is going on at the wholesale level (which virtually all freight is).  As you can see, we are now much higher than we were at when we were "pre-recession.  While the last month appears to have stabilized I cannot believe this curve is going anywhere but in the upward bound direction.  Fiscal stimulus is very strong in our economy and unless there is an existential threat (War, trade war etc.) I think we have at least two years to run on this cycle.  Learn to work in an inflationary cycle.  

Second, the infamous Inventory to Sales Ratio.  This tells us how much "slack" is in the economy and the story supports the inflationary pressures cited above. 
Inventory v. sales
In this graph we see that in about 2017, the "worm turned" and inventories started being depleted.

This has two implications.  First, it means that at some point, if sales stay strong companies will feel a need to restock inventory.  When that occurs we will see even more pressure on the transportation infrastructure of the United States.  This is not just a rate issue but rather has to do with the overall infrastructure of the country.  Pressure on bridges, roads, capacity and congestion all will continue to drive a very inefficient transportation network (including rail). 

Finally, we see the end results in the CASS Freight Index and it is not pretty. 
We continue seeing costs increasing in this very important index and they are at the highest levels we have seen in a long time.

These three pieces of data make it very clear we are in an inflationary environment for freight and it is not just an isolated lane or area of the country.  It is a broad based inflation due to fiscal stimulus driving an incredible amount of business.

Like the "spiral downward" we experienced in 2007-2009, we are not seeing a "spiral upward" with the market driving a "wealth effect" and the wealth effect drives consumer spending which ultimately drives everything we are seeing in freight.

Having said all this, there are pressures on the macroeconomic horizon.  Specifically, there are 4 things I worry about:

  1. Fuel Prices:  When fuel prices increase (both at the retail level which we buy at and the wholesale level the carriers buy at) it is just an implicit tax levied on people and businesses.  People have to drive for their work and their lives so it is really not a discretionary spend.  More money spent on fuel is less money spent on other things.
  2. Interest Rates Rise Too Fast:  We did get some good news last week with the Fed saying they may let inflation run above 2% but if the interest rate hawks take over, this could brake the economy hard.
  3. Student Loans:  There is an implicit brake on the economy with the large overhang of student loan debt.  If you think this is small, think again.  Here is some information from the website StudentLoanHero.com:
    • Total student loan debt:  $1.48 Trillion 
    • 44.2M Americans have some student debt
    • Delinquency rate is 11.2% (people who are more than 90 days behind)
    • Average Monthly Loan Payment: $351 
    • Median Monthly loan payment:  $203
  4. Existential Threat:  It seems we are just one "Tweet" away from global war or at least a trade war. 
Those 4 are the key ones which could put a stop to the party.  However, as a planner who manages probability, I would plan on the "party" continuing for the foreseeable future (But have your contingency plan B ready).  


Saturday, August 26, 2017

Interesting Supply Chain Events from Week of August 21, 2017

The week is over and some very interesting reads and developments.  Let me get right to them:


  1. The war between Amazon and Walmart heats up with the use of Google Home:  In Kevin O'Marah's great piece in Forbes (Google/Walmart: The Brutal Future of Retail Supply Chains)   he discusses the impact of voice assisted purchasing.  While some thought Amazon had this locked up, Walmart joins forces with Google and given Google's penetration into the virtual personal assistance market this may give Walmart an edge over Amazon.  Other implications of this:
    • Data flows directly from consumer to the manufacturer and could be the device that moves power back to the manufacturer and away from the retailer. 
    • Price discovery by the consumer will be faster and will result in a brutal retail environment. 
    • As Kevin states, if you are on a calendar based S&OP process, you may be too slow to adjust for what will be a rapidly changing consumer.

      This war shows retailing is really a war over efficient supply chains.
        
  2. Lean is almost always in the news however when I see my good friend Robert Martichenko launching a new lean blog I jump up and notice.  It is called "Lessons in Lean: Lessons in Leadership" and I will not repeat everything he is writing here.  Suffice to say, everything Robert reads is worth reading, this blog is no exception and I encourage you to read it directly. Specifically, the post titled: Is Reflection a Lost Art was very impactful for me and I have taken actions in my own personal journey reflecting some of Robert's thoughts.  It is a must read.
  3. More data supporting my previous post about leadership and being on the floor to lead and understand what is truly happening.  In "What CEO's can Learn From Their Frontline Workers", Mark Dohnalek does a nice job outlining why being on the floor and listening is an important trait of CEOS and all leaders.  It still is amazing to me how many CEOs spend more time in meetings than out in their facilities.
  4. CASS reported continued upward pressure on rates for a YoY basis and a MoM basis although the pace is slowing.  I will write more about this however I will say we are still far below 2012 - 2015 and I personally think we are starting to get to a precarious position.  A lot of investments and purchases are being made in anticipation of macro economic activity by the Feds (i.e., tax cuts which they call tax reform).  If this does not happen (which I give about a 50/50 chance) we will find people have gone far in front of their skis.  CCJ reports tonnage leveling out and conditions deteriorating.


    CCJ Report on July Truck Tonnage
    Looking at the Net Income and EPS of the large publicly held carriers and you see that it has, so far, been a "ho hum" year as their income is struggling to keep up with expenses.  Landstar, once again is the outlier and doing a fantastic job.  (See transcript from conference call here: Landstar (LSTR) Q2 Conference Call.
  5. The race for fast delivery of big box products is heating up with rumors of Overstock wanting to take advantage of XPO's incredible final mile delivery network.  While Overstock declined any agreement has been reached, I am just not sure how you execute fast delivery of things such as appliances and furniture without engaging XPO.  Bradley Jacobs, XPO CEO plans on being within 120 miles of 90% of the US population by the end of 2018.  Tough to find another competitor who can do that.
  6. The Inventory to Sales Ratio in the economy was updated last week and while we had been enjoying some good news, you can see it has turned and started to rise again.  This could be due to the holiday inventory stock up, which is being reported as being very robust and then again, it may not be.  More to come on this.  
    Inventory to Sales Raio - Updated August 15, 2017
Well, that ends a pretty exciting week and hope it was profitable and engaging for all.

Sunday, July 9, 2017

Inventories Are Heading in The Right Direction

Anyone who follows me knows I feel very strongly about the Total Inventory to Sales Ratio and how it forecasts the future for transportation (in the near term).  If inventories rise over a period of time then it only stands to reason companies will start cutting them back.  When they do that, freight slows to a crawl.

Recently, a lot has been made about the current measurement decreasing (ever so slightly).  As you can see below, they had been going down for most of 2016 and now have stayed steady in 2017:


Inventory to Sales Ratio through June 14, 2017
If you look at this in isolation - i.e., just the last year - you would say it is going in the right direction - which it is.  However, by looking at the full measure over a longer period of time you will see the "recovery" from 2012 to 2016 included a substantial inventory build.  We have just recently moved it down and it is a very slight move.   This tells me there is still substantial room for inventories to be depleted which also means transportation capacity still has a way to go before it becomes a "scarce" commodity.  Yes, there are blips but the longer term trend tells me the curve has room to decrease.

As a supply chain professional I also tend to cringe when I see the contents of this graph. To discuss this, let's ask ourselves why we have inventory in the first place.  Two key tenets of supply chain management:

  1. Inventory at rest is a bad thing:   Said a different way, bad things happen to inventory.  It can become obsolete, spoil (in the case of food), get lost, stolen or damaged. When inventory rests, you should see opportunity.
  2. Inventory exists as a buffer for lack of information:  In a world where you have perfect information (i.e, perfect forecast, perfect purchase signals, perfect transportation signals) you have little need for inventory. Given this, more inventory relative to your sales indicates your progress in S&OP (Sales and Operations Planning) information accuracy is stalling.  You are not improving this information flow, rather, you are making it worse which drives inventory levels. 
Put these two together and you have to ask yourselves if we, as supply chain professionals and as a supply chain industry, have made global supply chains worse or better since 2012?  With all the investment in software, data and analytics, you would think we would have at least stayed even.  But, we have not.  

What we have done as an industry is cut costs.  As reported in CSCMP's State of Logistics Report, we have decreased overall logistics' costs as a % of GDP for the first time since 2009.   But, to what end has this occurred?  The 5 year CAGR for storage costs for inventory is now at 3.6% - far higher than inflation.  While the financial cost of inventory has actually decreased, a lot of this is attributed to lower financing costs (i.e., interest rates) rather than great inventory management. 

The bottom line:  Inventory has been somewhat ignored during this time of incredibly favorable financing.  I do not expect this to continue and as this turns, it is going to turn quickly.  Expect a renewed focus on inventory and expect inventories to be managed a lot tighter in the future.  

And when that happens, expect any sign of a "transportation recovery" to stall (as it has in many years prior).  

Sunday, March 26, 2017

Macroeconomic Monday® - Inventory to Sales Ratio

Goes to show, I should never take a break from blogging.  "While I was out", the inventory to sales ratio in the economy has made a very nice move.  While not even close to the post recession area it is starting to move down which indicates the bleeding off of inventory has begun.  Of course, for transportation to tighten, and rates to go up, this will need to tighten some more.

While there is optimism, February retail sales at .1% definitely slowed this movement.

There is also the wild card of autos.  Ford has already warned on inventory and slow sales which means a lot of capacity becomes available as the automotive industry adjusts (read: idles plants).

More to come but let's call this a "good sign" if you are on the capacity side and an "early warning" if you are on the shipper side.

 
Inventories to Sales Ratio

Monday, October 24, 2016

CASS Report from September is Somewhat Grim - Macroeconomic Monday

OK, I am late to the party on this one, sorry but when I read it I thought I had to write, albeit, late.  The Cass Freight Index Report from September had virtually no good news in it.  The best thing they had to say was (actual quote), "... the YoY contraction [in expenditures] appeared to be less bad [than August]".  When all you can say is "It is not as bad as last month", you know it is bad.

On To the Numbers:

  • Shipments were down 3.1% YoY
  • Expenditures were down 3.8% YoY
And the industrial recession is on.  I think they rightfully state that the culprit may be the contraction in inventories.  I have written many times about the growth in inventory relative to sales and I think companies have realized they need to get rid of those inventories.  This means most product is already here and in the warehouses / stores and this reduces the need for transportation immensely. Why buy new product when you are so dramatically overstocked. 

Destocking takes bps out of GDP
This graph, from CASS, tells the story that destocking, while slowing down, is still a drag on the economy.  CASS says they are continuing to be concerned about too many autos, elevated inventory relative to sales and the fact that the consumer has not really dove in with both feet (or open wallet).  

Now, the key issue will be whether the Fed increases interest rates in December as everyone expects them to.  That will be a real problem as the economy, even if you think it is good, is truly running on just about one cylinder. 

What does this mean for shippers and providers:

I think the data is clear, and has been for at least two years now, and it is telling us that the shippers are in control (especially in ocean freight) and will be for the foreseeable future.  Of course, this is nothing to write home about as this means the economy is soft.  However, if you are shipping and you have a nice business you should take advantage of these soft times.  Believe me, when it swings, you better duck.  And, as all my readers know, you will not get benefit because you overpaid in a slow environment. 

Actions:
  • If you have not bid freight in a while - do it now. 
  • Lock in rates for two years if you can - a nice hedge
  • Move to a market based fuel system to take out any fuel fluctuations in the rating structure
  • Watch tender turn down rates.  This will act as a great "early warning" telling when / if the tide turns (don't expect this until 2018)

Monday, June 27, 2016

Macroeconomic Monday® Special Edition - Watch the Debt

I have read two major books recently on the economy - one old and one new. Both appear to be seminal books on what drives economic booms, busts and panics.  The two books are:  1) The Makers and The Takers: The Rise of Finance and The Fall of American Business by Rana Foroohar. 2) Manias, Panics and Crashes: A History of Financial Crises by Robert Z. Aliber.

The theme of both books is excess debt plays a huge role in the build up to any recession (or worse, depression).  The cycle goes something like this:

  1. Recovery begins through stimulus or some other external event (think war spending).
  2. The cycle takes off and should become self sustaining (Although we never saw that this cycle)
  3. Eventually it starts losing steam. In order to keep it going, we need to incur higher and higher amounts of debt. 
  4. In order to keep the higher debt going,  we have to allow sub-prime to participate. Not only does debt go up but debt quality goes down
  5. Eventually, defaults begin.
  6. People begin hoarding cash and spending less as they fear the economic downturn.  This causes  more defaults as layoffs begin. The downward spiral begins. 
  7. Voila!  Recession or worse and then we start all over again. 
This has been the case for hundreds of years (despite people wanting to go back to the "good old days",  hard depressions are less harsh now and certainly less frequent).  As we see freight volumes going down and with that, freight rates going down, I have to ask, are we starting to see this cycle in its later stages?  Certainly, we are at the tail end of an expansion but what does the debt data tell us?  

In this and subsequent editions of Macroeconomic Monday® I am going to attempt to explain where I think we are.  Today, we will look at three topics:  The overall debt (Household) in the nation, the makeup of that debt and finally the quality of auto loans.

The graph the the left depicts the issue at hand.  As you can see from this chart our overall household debt is almost at pre-recession levels. Two other key points are clear from this chart:
  1. The debt level relative to 2003 is incredibly high.
  2. The amount of debt due to student loans has grown exponentially (yes, this is a big problem - student loans cannot be discharged in bankruptcy and do not have physical assets behind them).
Mortgage debt is still inflated and the very interesting part of this chart is the growth of auto loans. The key part to this, as explained in the graph below, is more and more auto loans are made to the sub-prime sector of the economy. 

This graph shows more detail on the auto sub-prime loans (When you see your friend get that new BMW, you have to wonder where the money came from).  You can see that auto sub-prime really telegraphed the previous recession and then people clamped down on their borrowing to right their personal balance sheets.

However, really since about 2011 this has changed and the sub-prime borrowing started taking off again. This was almost fully due to automobile companies needing to keep the "post recession party" going.  

So, our first lesson is pretty clear, and stark.  Personal debt is growing and total debt is almost at the pre-recession levels. For one of the biggest and riskiest categories (auto loans), sub-prime debt is increasing. Finally, student debt, which stops or delays household formation, is clearly at unsustainable levels.

Following our guidance in the two books I mentioned above, this is the "brake" on the economy which never lets the flywheel turn on its own.  It is also why markets go into turmoil every time Janet Yellen even remotely mentions increasing interest rates. This brake is why freight volumes are down, we have over capacity in transportation and rates are starting to plummet.  If people do not buy, companies do not make and therefore freight capacity exceeds volumes and rates go down. It is that simple. 

So, the next time someone says to you "things will get better next year", remember the debt story. They cannot get better when more and more money is going to pay interest on debt incurred for items already purchased.  And, of course, this is why you are seeing negative interest rates as central banks realize that is the only way to fight this.  But, more on that next time.  


Wednesday, June 22, 2016

Predictions Coming True - Inventory Adjustment Under Way and Rates are Down

A special edition of Marcoeconomic Monday today!  The results are in and they are really showing a slowing economy (GDP adjustments have been lowered), inventory adjustments being made and therefore truckload and intermodal rates going down.

I have shown throughout this year that the inventory to sales ratio was telling me that inventory was growing at an unsustainable rate and sooner or later a correction will come.  The Wall Street Journal recently acknowledged this with an article called: Inventory Pullback a Drag on Logistics Spending. As companies have realized the need to adjust inventory levels, the need for more product decreases and therefore the need for transportation goes down.  Result?  A capacity / demand imbalance that supports lower rates.

The newest CASS readings show this is coming out in the industry rate structure.  The truckload index fell 1.2% in May after reductions in April and March.  The intermodal index reduced by 2% and Cass has acknowledged this is 17 consecutive months of YoY declines.

Bottom line:  Rates are going down, the economy continues to sputter and another year of "this is the year" seems to be fading away.

Saturday, April 30, 2016

Inventories Continue to Grow

For those who read this blog regularly, you know a key metric I track regularly is the Inventory to Sales ratio.  The reasons I do this are threefold:

  • As a supply chain professional and one who takes pride in our industry I feel this one measurement is a core metric to how the industry is doing.  Of course, inventory is built when information is less than optimal and therefore we miss forecasts or we feel the only solution to this problem of lacking information is to build inventory stocks. Finally, we all know inventory ties up working capital, has the problems of obsolescence, damage and shrinkage and consumes resources.  All of which is bad for business.
  • It is an early warning indicator of economic issues.  As either consumers stop buying or business start overproducing (due to irrational exuberance to borrow a phrase) inventories build.  So, it is a signal that one of those two things are happening and sooner or later either the consumer has to come raging back (highly unlikely given the wage situation) or businesses will start cutting back.
  • It is an indicator of pricing in transportation.  As inventories build, inbound will start slowing, transportation capacity will become in excess and ultimately prices fall for transportation.  It is, in fact, that simple.
As we look at the latest Inventory to sales ratio we see continuation of a troubling pattern:

Inventory to Sales Updated 4/2016 Data through February 2016
What we see is inventories have increased pretty dramatically since 2012 and do I dare say this - they are almost at recession levels.  

This is not a good indicator for the economy or for transportation in general.  Perhaps the wild bull is coming to an end. I guess we shall see but one of two things has to happen - consumers better start buying or businesses better slow down.  

Saturday, February 6, 2016

More Tough News for the Rail Roads - Carloads Dropped 16.6%

The January AAR report has come out and it is not pretty for the railroads.  Of course coal has been a big driver but it looks like all commodities are in a decline and that has really hurt the rail. Intermodal is up 3.4% which is "ok" but nothing spectacular.

Bottom line is the economy is just slow and not sure when it will come out of this.  I have not written my "Macroeconomic Monday" report in a long time but I can tell you that the dynamics of this economy are very slow growth, tepid employment and lack of wage growth.  All of this is driving the consumer to save more or pay down debt which limits macro demand.  This is always first seen in the transportation of goods.

More to come... Buckle up for 2016.

Courier and Delivery Driver Employment Fall; Warehouse Employment Up

Post the holiday e-commerce surge, the inevitable arrived.  According to the Wall Street Journal, courier and delivery jobs were shed quickly by companies with lower demand.

Warehouse employment continues to outpace the overall economy.  Just go to towns like Lakeland, FL, Memphis, TN or Nashville and you can see that for mile upon miles.

What is fascinating about all this is this means buffer inventory is increasing. The graph below shows the incredible climb of inventory relative to sales in our economy.  Wasn't this what all this fancy supply chain software was supposed to solve?

Inventory to Sales Ratio
We are back to roughly 2002 levels which, if you measure supply chain efficiency by inventory levels you could say that we are in a "lost decade" of supply chain improvement.

Monday, May 25, 2015

Inventory to Sales Ratio is Not Showing a Pretty Picture - Macroeconomic Monday is Back!

All the data I am seeing is indicating some real softness in the economy. At first, people thought it was the weather and then we went to the port strike.  However, now we are starting to see some real convergence of data pointing to a slower economy:

Inventory to Sales Ratio:

As we can see by the FRED graph, this has been on a climb however the slope has increased.  Essentially, this is indicating that inventory is building in the supply chain and there is not adequate sell through.  Every time this indicator has turned this way, we have seen ultimate softness (as companies work to right size the inventory) and this means softness in the freight markets:

You can see that this is nothing like the spike during the "great recession" however you also clearly can see that when this goes up, recessions do follow (or this is just an indicator of the recession as it happens.

ATA Truck Tonnage Drops in April; Off 5.3% from High in January:

The ATA freight tonnage index peaked in January and has been struggling ever since.  While increasing 1% over prior year, it is down 5.9% against previous month, down 5.3% against high in January and indications are the freight index will stay soft.  This will drive lower expectations for GDP and, once again, our dream of a year above 3% GDP is starting to fizzle.

While the CASS freight index is still showing some healthy gains in pricing, I really attribute that to the successful "fear mongering" of the carrier base.  If buyers of freight truly were objective about the data, they would aggressively be seeking price decreases and not stand for any price increases.  This will utimately turn down once the shippers realize what is happening and once the buyers start getting pressured by their managers to adjust the cost basis to reflect what is really happening.

Manufacturer's Alliance for Productivity and Innovation (MAPI) Adjusts Manufacturing Growth to 2.5% From Previous Estimate of 3.5%.

This is a big movement and they attribute this to four key areas from their report:
  1. Oil and natural gas prices collapsed, causing a sudden contraction of the energy supply chain.
  2. The strong U.S. dollar reduced growth, a result of cheaper imports to the U.S. and U.S. exports becoming more expensive to foreign buyers, as well as deflation pressure on exports.
  3. Consumers spent some of their fuel savings in the fourth quarter of 2014.
  4. The inventory-to-sales ratio rose sharply in the first quarter, while the inventory runoff in the second quarter slowed production growth
The interesting item of all of this is in item #3 above.  Where is all the money gone that the consumer is saving due to low fuel prices?  I think it is has gone into the bank or the continued deleveraging of households - meaning people are still not buying.

Without some real big changes, I think we are in for another "sputter" and halt type economy - we are far to used to this now.  


Tuesday, November 12, 2013

Behind The 2.5% GDP Number.. Not So Fast

The initial read on Q3 GDP seemed pretty impressive at 2.5%.  That would indicate things are moving along and creeping up to the 3% "benchmark" everyone is waiting for.  However, like all things, there are the numbers then there are the numbers.

I had heard on NPR that the inventory numbers seemed elevated so I did some quick research and sure enough it appears that at least .5% of the GDP number was due to the growth in inventory. Of course, making things and throwing them in warehouses is not a driver of growth.  It is more like a ponzi scheme.

Forbes said the following:
"When you remove inventory accumulation and external trade, explains Capital Economics’ Chief US Economist Paul Ashworth, you get a slowing 1.7% growth rate of final sales to domestic purchasers. Ashworth calls this less impressive metric “a better gauge of underlying economic strength.”

What are the implications for shippers and transporters:

  1. The economy is not growing like the front page numbers may imply.  Things are sluggish for the most part with some strength industries - although those are not big freight industries.
  2. Due to the growth in inventory, there has been a "pre-positioning" that will have to bleed off.  This means, at some point, inbound freight will slow down dramatically waiting for the inventory to be sold. 
  3. Nothing indicates freight will speed up.  This slow freight environment which means demand is decreasing at least as fast as supply will be the "new normal" for at least one year. 
Everything I read and see says this slow "new normal" freight environment will go through 2014 at a minimum.  

Lesson:  Always read "behind" the numbers. 

Tuesday, August 27, 2013

Economic Gains - Concept or Reality?

Don't want to be a "debbie downer" here but I came across this article in Logistics Management Magazine titled: Economic Gains are Sometimes More of a Concept Than Reality.  I tend to agree with the author on this one and said as much in my Macroeconomic Monday post last week.

Saturday, August 17, 2013

Macroeconomic Monday® - The Demographic Shift to Multi Family, City Dwelling is Real

For those reading this today, Saturday, I normally write this on Saturday then post on Monday.  But, I figured if you want to read on Saturday why not?  However, the name remains the same.

So, last week was an incredible week for economic news and the stock market.  I remind everyone who may think the financial sky is falling that the S&P is still up close to 18% this year so I would not fret too much (Unless you are a late comer to the party then you may wonder what happened).  From a purely financial point of view this week was bound to happen.  Call it reversion to the mean, a short correction or whatever you want the bottom line is stocks cannot just keep going up forever.  The curve is not smooth and if you want it to be smooth then you are involved in the wrong business.

But, there were some very interesting dynamics.  First, retail spending continues to be softer than the analysts predicted.  Sometimes I wonder if the analysts are really forecasting or are they hoping - I have said all along that until unemployment changes significantly (i.e. at 6% or below), retail is going to suffer.  Yes, there are some "must have" items which hit a replacement cycle (Cars and appliances) that you just have to replace no matter what.  But, the discretionary is where consumers just are not going to spend their money.   The graph to the right outlines the anemic changes in retail sales and it shows a very variable and anemic growth for retail sales. My readers know I do not buy into this "weather" blame game people make for why this is adjusted.  The bottom line is it just looks like people are buying essentially what they need.

The other big event was the move in the 10 year note.  This graph is even more telling about what is going on in the economy where you can see the interest rates are spiking fast.

The 10 yr T-Note of course is what a lot of mortgages are tied to which drives the housing market.  This is another "KPI" I monitor for the economy.  If the 10 year T-Note gets above 3% watch out!

Yes, I know and have heard many say that these are incredibly artificially low interest rates and so going above 3% is more of a reversion back to the mean or the norm.  My response channels the blog posting I made recently about Nate Silver and the idea of "out of sample".  Yes, in normal times the 10 Year T-Note should be at 3.5% to 4% and we should be able to live with it.  However these are not normal times.  We are above 7% unemployment, we are coming off of the worst recession (some say depression) since the 1930's and even for those employed many are dramatically underemployed.   So, imagine a scenario where you have 7% or above unemployment AND interest rates above 4%?  That is not a good indicator for the economy.

Finally, this leads to the behavior of the home buyer.  They are not buying.  What they are doing is moving into multi family dwellings. While multifamily dwellings increased over 26%, the building of single family homes declined by 2.2%.  On average people spend more money on other things (think lawnmowers, curtains, a lot more furniture, nicer appliances etc. etc.) when they move into single family homes rather than when they move into multi family homes.  This will be a net drag on the overall consumer spending numbers even though it will keep the builders busy for a short period of time.

So, in summary, we have a situation where the consumer has closed their wallet, interest rates are rising, single family homes are in decline.  All speaks for a sluggish economy with some bright spots (autos for example).  Freight will remain low (especially after these retail numbers) and hopefully the continued rise in 10 Year T-Notes will not choke off any semblance of recovery we may have going.

Thursday, August 15, 2013

Wal-Mart Guides Lower - Sales Weaker

Reporting this morning, Wal-Mart is describing slow sales, and it has guided the street lower for the remainder part of the year.  This is not good news but not unexpected for my readers.  Until unemployment gets to 6% or lower you can expect to see a slow tough slog on consumer goods and that will deflate the demand for trucks. If you have to continue to look at one economic number which ultimately will drive the demand for transportation, look at unemployment.

If Wal-Mart guides down 1.5% to 3%, which is roughly what the news is saying this morning, that is a lot of empty trucks and containers on the road looking for freight.

Consumer durables appears to still be a strong point in the market but overall the story of a tough slog continues to hold true.

Thursday, August 1, 2013

What Does 1.7%GDP Growth Mean for Transportation?

This week the first look at Q2 GDP came in and the number was 1.7%.  Headlines were anywhere from "GDP Crushes Expectations" (Set  the bar low) to "GDP Hardly Booming but no swoon in sight".  The key factor for which headline you believe is what were your expectations to start with?  Personally, I am in the camp that regardless, 1.7% is very anemic growth rate, it will not solve our unemployment problem and it will keep our economy somewhat mired for a long time.

But, what does it mean for transportation?  I believe this is just another indicator to show demand is very tepid and will remain that way for some time.  Revisions for GDP growth in Q1 were revised downward which means my experience meter seemed to have a better handle on GDP than the experts (I just look around and talk to people - Q1 was clearly worse than people had said).  The Q1 number was revised down from 1.8% to 1.1%.  Last three quarters have been less than 2% growth in each quarter.

For transportation this translates into lower demand and while there may be a little bit of capacity issues due to hours of service (HOS), demand is going down faster than capacity so net-net we are at balance or, in fact, slightly over capacity.  In total we are seeing real overcapacity in intermodal as the big rush to get into that space has caused a huge container growth at the various IMCs.

The story from the transportation economists a few years ago was when you see 3% GDP growth that is when transportation rates will start going up.  Of course, they have now changed that tune since 3% isn't anywhere near possible in the near future so the fear game is on hours of service.

However, my advice continues to be:  Those who do not allow emotion, fear and "the government regulation boogey man" get to them will use real data to determine what is really happening.  They will find capacity is there, rates are steady and in some cases going down, and for the foreseeable future that will be the story.

Keep calm and be diligent about your data analysis and you will find, while low GDP is not what we want for other reasons, this is probably a good time to be a buyer of transportation.  If you stay calm while your competitors panic, you really can pick up some competitive advantage points during this period.

Monday, June 10, 2013

Macroeconomic Monday® - A tale of Two Economies

There are two economies developing and it is very important you do not confuse the two.  The first economy is the financial  economy.  This is Wall Street, investing, arbitrage and commodities.  When bundled together this economy is on a tear.  It is booming and if your business is just to make money with money the Fed has become your friend and your company is most likely doing very well.

The drawback to the financial economy  for my readers is just this: There is no freight.  There is no freight in the booming of Wall Street.  Nothing is produced, shipped and delivered beyond bits and bytes of data which magically turns into money in your bank account.

There is the second economy which is the physical economy.  This is the area where my readers and I have participated for most of our lives and this area is operating in a murky, up and down environment and is not nearly as "booming" as the financial economy.  While the financial economy, in a lot of cases, is at a pre-recession level, the physical economy is not.

Here is why it matters for us logisticians.  If the physical economy does not improve we will continue to mired in a low freight environment while at the same time believing the economy is booming.  This is why shippers need to keep a real eye on the actual physical economy and not let the financial economy sway their opinion.  Will capacity continue to decrease?  Yes.  However, and unfortunately, demand for goods seem to be decreasing as well.

You need look no further than the unemployment rate to know why.
 The graph to the left shows us in a stubborn range of unemployment.  As many economists have discussed this also does not reflect the underemployed, those who have stopped looking and those who are employed but are too scared to spend due to a fear of losing their job.

The simple fact is when unemployment is this high people will hold onto money and not spend it.  When they do not spend, their is nothing to move.  And, this translates into lower freight volumes.

This can be reflected in my infamous love affair with the inventory to sales ratio.
 This ratio has stayed flat for a while and recently had a small uptick.  We will be getting a new reading this Thursday but the trend line is clear:  Businesses thought sales would increase, inventory went up and the sales did not come.

Again, more indication of a lack of freight demand.  This also means that when demand picks up there will be a lag in freight demand as inventories will need to clear out.

The summary is simple:  While last week may have ended with a bang on Wall Street, it was a thud on main street - inventories up, unemployment up, construction spending did not keep pace with expectations and manufacturing actually contracted.

In a real perverse way, you know the physical economy is doing poorly when the market is up because the market is being driven by the expectations for the FED to keep rates low and keep the quantitative easing program going.  When physical economy results come in below expectations, the traders believe this will keep the Fed going, which will then boost the market.  If you see the market collapse then, perhaps, we will see a signal in the growth of the physical economy as the market collapsing will be an indicator the traders believe the Fed will be backing away.

What is down is up!


Saturday, April 6, 2013

The Jobs Report Relative to Logistics: Families Enjoy Life More With Less?

The major economic news yesterday which, for a short period of time shattered the markets, was the jobs report.  Some key statistics from the Bureau of Labor Statistics (BLS) press release:
  • Employment up 88K (Far below estimates)
  • Long Term unemployed remained constant at about 4.6M
  • Unemployment rate ticked down ever so slightly 7.6%
However the big number people were concerned with was the level of unemployed people who have dropped out of the labor market.  This number was a whopping 496K.  And of course this brings huge concerns to those of us (logisticians) involved in moving goods to market.  If the market shrinks then there are less goods to move to market - it is that simple.

What this jobs report reinforces are two major headwinds to the economy:
  • Level of unemployed is staying relatively flat 
  • Those who are employed will continue to feel restrained as they feel their employment could be at risk. 
Both of these mean that demand will continue to be stubbornly low and freight volumes will continue to be restrained.  Having said that, what I am most concerned about is the graph below:


This graph highlights the issue of those who have dropped out of the employment market.  As you can see we are bouncing around a bottom but the number is around the level we were at in the mid 1980's.  Two causes for this and both are a headwind for logistics:
  • People cannot find employment - restrained spending
  • People do not want to find work - A major societal shift. 
 Of these, I am most interested in the second one which could have long term and structural consequences to the economy and to the freight enviornment.  To be clear, this is not a judgement and I am not saying these are freeloaders.  What I am saying is just like companies have now become used to producing more with less, families have now realized they can enjoy life more with less.   Families that felt it was necessary to buy a lot of "things" and thus demanded two incomes have found out one income with a lot less "things" is actually pretty enjoyable.

No matter which way you look at this, we know this is not a good sign for a robust freight recovery.